
 有一天小編被問到,像這種畫面是怎麼弄的?怎麼樣才能在圖上標進出場點?
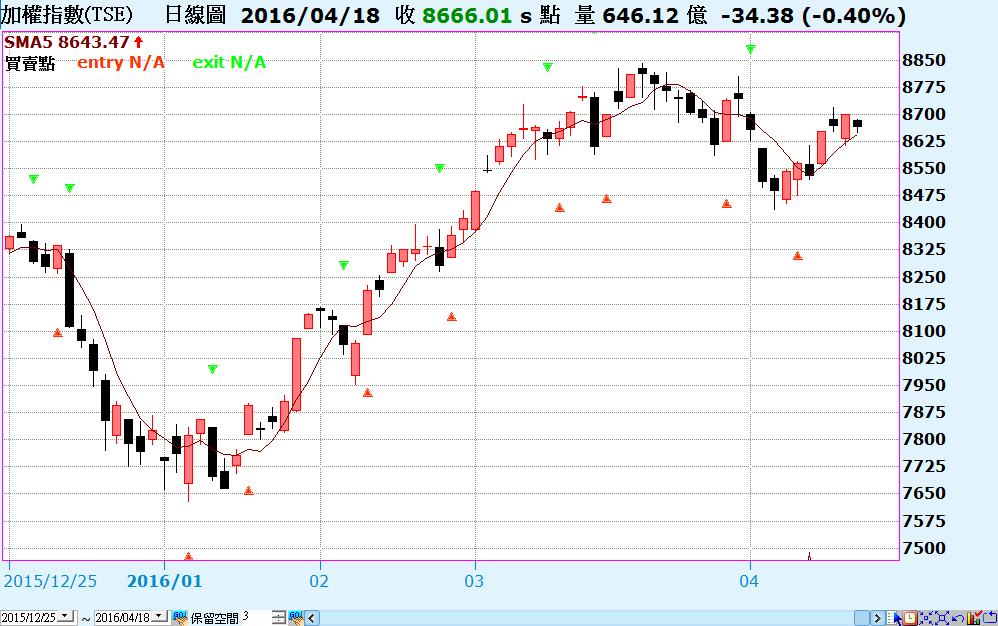 其實一點都不難,調整一下繪圖的樣式設定就行了。今天我們用一個例子來說明如何在K線圖上繪製進出場訊號。小編舉的例子很簡單,就是拿5日均線當作參考,站上5日均線就進場做多,跌破5日均線就多單出場。腳本如下:
variable: intrabarpersist position_1(0); // 目前position
variable: intrabarpersist entry_price(0); // 最後一次進場的價格

//進場邏輯
//
condition1 = close crosses above average(close, 5);
// 出場邏輯
//
condition2 = close crosses below average(close, 5);

if position_1= 0 then
begin
if condition1 then
    begin
        position_1= 1;
        entry_price = close;
        print("(ENTRY) Date:", Date, " EntryPrice:", entry_price);
        plot1(low * 0.98, "entry");
    end;
end
    else
        begin
        if condition2 then
            begin
                position_1= 0;
                entry_price = 0;
                print("(EXIT) Date:", Date);
                plot2(high * 1.02, "exit");
            end;
        end;
由於今天的主題是說明怎麼樣在圖上顯示進出場點,所以千萬不要問小編這個策略會不會賺錢......不過如果有人對腳本內容有興趣,可以寫信給我們,這樣小編又可以多寫一篇文章。在這個腳本中,我們把進場訊號的點位存在plot1,出場訊號的點位存在plot2。直接疊加到主圖上,畫面是這個樣子。 接下來要在繪圖樣式中,變更指標的樣式、粗線、顏色等屬性。在XS編輯器左邊的公式面板中,找到買賣點腳本,點擊右鍵開啟選單,選擇繪圖設定開啟繪圖設定視窗。
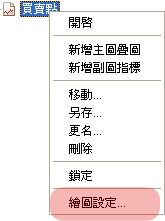 首先把樣式變更為點,每個點其實就是一個預設的圖示,目前內建有15種圖示(如圖)我們把進場樣式設成▲,把出場樣式設定成▼;顏色也同時調成紅色和綠色。
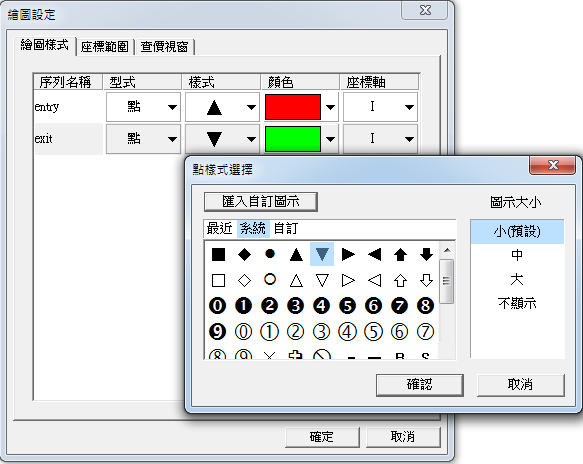 如果不喜歡”系統“內建圖示,也可以利用右邊的”自訂“功能,將偏好的圖示給匯入,系統就可以使用匯入的圖示來繪製指標
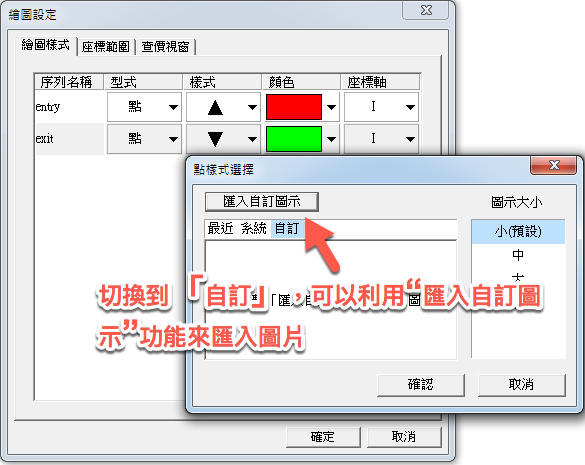 點擊確定儲存後,再重新將指標疊加到主圖,就可以在技術分析圖上看到買賣點的標示。 最後要提醒大家的是,小編特地把進出場邏輯是寫在獨立的段落。也就是說,只要把condition1和condition2替換成你現有的進出場邏輯,就可以直接在圖上顯示買賣點摟。有任何建議歡迎來信,我們下次見!
